
Cryptocurrency price charts are essential tools for traders, investors, and enthusiasts navigating the volatile world of digital assets. These charts visually represent price movements over time, offering insights into market trends, patterns, and potential opportunities. Understanding how to read and interpret crypto price charts is crucial for making informed decisions in this fast-paced market. This article explores the components of crypto price charts, common chart types, key indicators, and tips for effective analysis.
What Are Crypto Price Charts?
Crypto price charts display the historical and real-time price data of cryptocurrencies like Bitcoin, Ethereum, or altcoins. They plot price movements against time, allowing users to analyze how a cryptocurrency’s value changes. Charts are typically accessed through exchanges (e.g., Binance, Coinbase), trading platforms, or dedicated charting tools like TradingView or Coinigy.
The primary purpose of a price chart is to help users identify trends, predict future price movements, and make strategic trading decisions. Charts vary in complexity, from simple line graphs to advanced candlestick charts, but all provide critical data for market analysis.
Key Components of Crypto Price Charts
To effectively read a crypto price chart, you need to understand its core elements:
- Time Axis (X-Axis): The horizontal axis represents time, which can range from minutes to years. Common timeframes include 1-minute, 1-hour, 1-day, or 1-week intervals, depending on the trader’s strategy (e.g., day trading or long-term investing).
- Price Axis (Y-Axis): The vertical axis shows the cryptocurrency’s price, typically in a fiat currency (e.g., USD) or another cryptocurrency (e.g., BTC). The scale can be linear or logarithmic, with logarithmic scales better suited for long-term analysis of assets with significant price volatility.
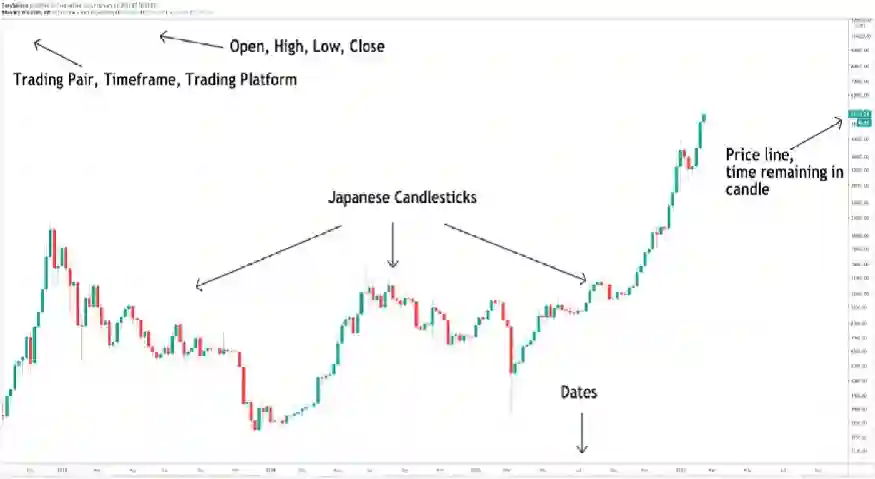
- Price Data: This is the actual representation of the cryptocurrency’s price over time, displayed as lines, bars, or candlesticks.
- Volume: Many charts include a volume histogram at the bottom, showing the amount of cryptocurrency traded during a specific period. High volume often confirms the strength of a price movement.
- Indicators and Tools: Charts often integrate technical indicators like moving averages, Relative Strength Index (RSI), or Bollinger Bands to provide additional insights.
Common Types of Crypto Price Charts
Different chart types cater to varying analytical needs. Here are the most common ones:
- Line Charts: These are the simplest, plotting a single line connecting closing prices over time. They’re ideal for beginners or for observing long-term trends but lack detailed intraday data.
- Candlestick Charts: Widely used by traders, candlestick charts provide more information, showing the opening, closing, high, and low prices for each time period. Each “candle” represents a timeframe, with the body indicating the open and close prices and the wicks showing the high and low. Green (or white) candles typically indicate price increases, while red (or black) candles show declines.
- Bar Charts: Similar to candlestick charts, bar charts display open, high, low, and close prices (OHLC) but use vertical lines with horizontal ticks. They’re less visually intuitive than candlesticks but still informative.
- Heikin-Ashi Charts: A variation of candlestick charts, Heikin-Ashi smooths price data to highlight trends, making it easier to filter out market noise.
Key Technical Indicators for Crypto Charts
Technical indicators are mathematical calculations applied to price and volume data to identify patterns or predict future movements. Some popular indicators include:
- Moving Averages (MA): These smooth out price data to identify trends. The Simple Moving Average (SMA) and Exponential Moving Average (EMA) are common, with crossovers (e.g., 50-day MA crossing 200-day MA) signaling potential buy or sell opportunities.
- Relative Strength Index (RSI): RSI measures momentum on a scale of 0 to 100. Values above 70 indicate overbought conditions, while values below 30 suggest oversold conditions.
- Bollinger Bands: These plot standard deviations above and below a moving average, helping traders identify volatility and potential breakouts.
- MACD (Moving Average Convergence Divergence): This indicator shows the relationship between two EMAs, helping traders spot changes in momentum.
Tips for Analyzing Crypto Price Charts
- Choose the Right Timeframe: Short timeframes (e.g., 1-minute or 5-minute) suit day traders, while longer timeframes (e.g., daily or weekly) are better for long-term investors.
- Combine Indicators: Avoid relying on a single indicator. For example, use RSI to confirm signals from moving averages.
- Watch for Patterns: Chart patterns like head and shoulders, triangles, or double bottoms can indicate potential reversals or continuations.
- Monitor Volume: Significant price movements with high volume are more likely to sustain than those with low volume.
- Stay Updated: Cryptocurrency markets are influenced by news, regulations, and macroeconomic factors. Combine chart analysis with fundamental research.
Challenges and Limitations
While crypto price charts are powerful, they have limitations. The crypto market is highly volatile, and external factors like hacks, regulatory changes, or whale movements can disrupt technical patterns. Additionally, technical analysis is not foolproof; it relies on historical data, which doesn’t guarantee future results. Overreliance on indicators without understanding market context can lead to poor decisions.
Conclusion
Crypto price charts are indispensable for anyone looking to navigate the cryptocurrency market. By understanding chart types, components, and technical indicators, you can gain valuable insights into price movements and make informed trading or investment decisions. However, successful analysis requires practice, discipline, and a balanced approach that combines technical tools with market awareness. Whether you’re a beginner or an experienced trader, mastering crypto price charts is a step toward thriving in this dynamic and exciting space.