
Crypto technical analysis is a powerful method used by traders to predict future price movements of cryptocurrencies like Bitcoin, Ethereum, and altcoins based on historical price data and market patterns. Unlike fundamental analysis, which evaluates a cryptocurrency’s intrinsic value, technical analysis focuses on charts, indicators, and trends to make data-driven trading decisions. In the volatile crypto market, mastering technical analysis can provide a competitive edge. This article explores the fundamentals of crypto technical analysis, key tools, popular strategies, and tips for success.
What Is Crypto Technical Analysis?
Technical analysis (TA) is the study of historical price and volume data to forecast future price behavior. It operates on three core principles:
- The Market Discounts Everything: All relevant information, including news and sentiment, is already reflected in the price.
- Prices Move in Trends: Prices tend to follow trends (upward, downward, or sideways) until a reversal occurs.
- History Repeats Itself: Market patterns and behaviors often recur, driven by human psychology.
In crypto, TA is particularly valuable due to the market’s high volatility and 24/7 trading cycle. Traders use charts and indicators to identify entry and exit points, manage risks, and capitalize on price swings.
Key Tools in Crypto Technical Analysis
To perform technical analysis, traders rely on charting platforms (e.g., TradingView, Coinigy) and a variety of tools. Here are the essentials:
1. Price Charts
Charts visualize price movements over time. The most common types include:
- Candlestick Charts: Show open, high, low, and close prices for a given timeframe. Green candles indicate price increases, red candles show declines.
- Line Charts: Plot closing prices, ideal for spotting long-term trends.
- Bar Charts: Display similar data to candlesticks but in a less visual format.
2. Technical Indicators
Indicators are mathematical calculations applied to price and volume data. Popular ones include:
- Moving Averages (MA): Smooth price data to identify trends. The Simple Moving Average (SMA) and Exponential Moving Average (EMA) are widely used. A “golden cross” (short-term MA crossing above long-term MA) signals bullishness, while a “death cross” indicates bearishness.
- Relative Strength Index (RSI): Measures momentum on a 0–100 scale. RSI above 70 suggests overbought conditions; below 30 indicates oversold.
- Bollinger Bands: Plot volatility bands around a moving average to identify overbought or oversold conditions and potential breakouts.
- MACD (Moving Average Convergence Divergence): Tracks the relationship between two EMAs to spot momentum shifts.
- Fibonacci Retracement: Identifies potential support and resistance levels based on key ratios (e.g., 38.2%, 61.8%).
3. Volume Analysis
Volume, shown as histograms on charts, indicates trading activity. High volume during price movements confirms trend strength, while low volume may signal weakness.
4. Chart Patterns
Patterns help predict price reversals or continuations. Common ones include:
- Head and Shoulders: Signals a trend reversal (bullish or bearish).
- Triangles (Ascending, Descending, Symmetrical): Indicate consolidation before a breakout.
- Double Top/Bottom: Suggests a reversal after two peaks or troughs.
Popular Crypto Technical Analysis Strategies
Traders combine tools to develop strategies tailored to their goals. Here are three widely used approaches:
- Trend Following: Traders identify and follow trends using moving averages or trendlines. For example, buying when the price is above the 50-day EMA and selling when it drops below.
- Breakout Trading: Focuses on price breaking through support or resistance levels, often confirmed by high volume. Traders enter positions when the price breaks out of a triangle or range.
- Mean Reversion: Assumes prices will revert to their average after extreme moves. RSI is often used to identify overbought or oversold conditions for entry points.
How to Apply Technical Analysis in Crypto
- Choose a Timeframe: Short-term traders (scalpers, day traders) use 1-minute to 4-hour charts, while long-term investors prefer daily or weekly charts.
- Combine Indicators: Use multiple indicators to confirm signals. For example, pair RSI with MACD to validate momentum shifts.
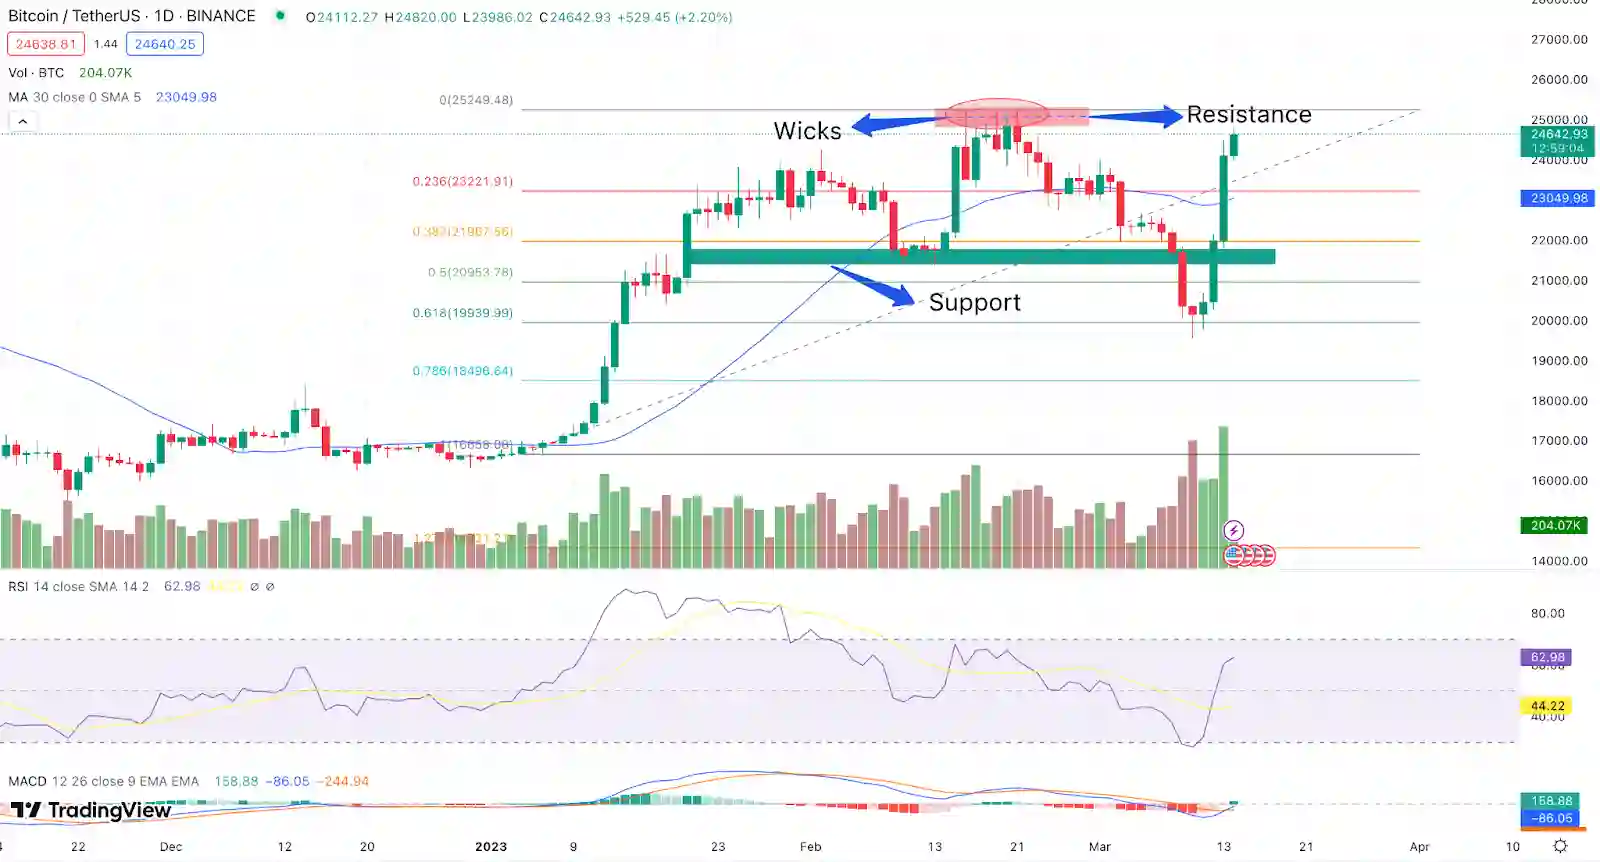
- Identify Support and Resistance: These are price levels where the market historically reverses or consolidates. Fibonacci retracement or horizontal lines on charts help pinpoint them.
- Backtest Strategies: Test your approach on historical data to assess its effectiveness before risking real capital.
- Manage Risk: Use stop-loss orders and position sizing to limit losses, especially in crypto’s volatile market.
Challenges of Crypto Technical Analysis
While powerful, technical analysis has limitations:
- Market Volatility: Crypto prices can be erratic due to news, whale activity, or regulatory changes, disrupting technical patterns.
- False Signals: Indicators can produce misleading signals, especially in choppy markets.
- Overreliance: TA doesn’t account for fundamental factors like project development or adoption, which can drive long-term value.
- Liquidity Issues: Low-volume altcoins may show unreliable patterns, making TA less effective.
To mitigate these, combine TA with fundamental analysis and stay informed about market news.
Tips for Success in Crypto Technical Analysis
- Practice Consistently: Use demo accounts or paper trading to hone your skills without financial risk.
- Stay Disciplined: Stick to your strategy and avoid emotional decisions driven by fear or greed.
- Keep Learning: The crypto market evolves rapidly. Study new indicators, patterns, and tools to stay ahead.
- Use Reliable Platforms: Choose charting tools with real-time data and robust features, like TradingView or Binance’s built-in charts.
- Monitor Market Sentiment: Check social media platforms like X for real-time sentiment that may impact price movements.
Conclusion
Crypto technical analysis is an essential skill for navigating the dynamic cryptocurrency market. By mastering charts, indicators, and patterns, traders can make informed decisions to capitalize on price movements. However, success requires practice, discipline, and an awareness of the market’s unique challenges. Whether you’re a day trader or a long-term investor, combining technical analysis with risk management and market research will enhance your ability to thrive in the exciting world of crypto trading.